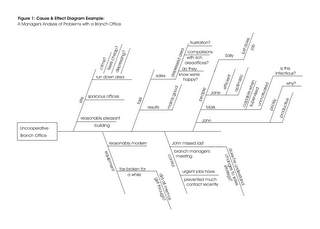
The cause & effect diagram is the brainchild of Kaoru Ishikawa, who pioneered quality management processes in the Kawasaki shipyards, and in the process became one of the founding fathers of modern management. The cause and effect diagram is used to explore all the potential or real causes (or inputs) that result in a single effect (or output). Causes are arranged according to their level of importance or detail, resulting in a depiction of relationships and hierarchy of events. This can help you search for root causes, identify areas where there may be problems, and compare the relative importance of different causes.
If the influence level of the factor is quantitatively Pareto chart.
No comments:
Post a Comment